Ground Truths: What My Coffee Data Revealed ☕️
An Evaluation of Coffee Roasts and Brewing Methods: A Personal Tasting Study

Project Overview
This project started as a way to test a long-standing assumption of mine: that I don’t enjoy light roast coffee. Rather than continuing to rely on instinct, I decided to gather real data and evaluate whether that belief holds up under scrutiny.
This wasn’t intended to be a rigorously controlled experiment. Instead, the aim was to enjoy a more traditional, hands-on, end-to-end approach, from collecting and tasting to evaluating coffee, with an emphasis on curiosity and accessibility over technical complexity. The focus is on making the process easy to follow rather than overly analytical, and the writing reflects that.
As I explored roast preferences, I also began comparing brew methods, particularly Aeropress vs Moka Pot, to see whether preparation style influenced how much I enjoyed each cup. What started as a simple tasting experiment turned into a satisfying application of data science principles to a daily ritual, as a small, manageable side project I could do alongside more complex work.
🎯 Goal
My goal was to determine whether I consistently rate light roasts lower than medium or dark roasts, as I’ve always believed.
To frame it formally:
Null Hypothesis (H₀):
μL ≥ μ¬L — I rate light roasts at least as highly as other roasts.Alternative Hypothesis (H₁):
μL < μ¬L — I rate light roasts lower than other roasts (supporting my belief).
Methodology:
Data collection:
I tasted 28 different varieties of (decaf) coffee across a mixture of light, dark and medium roasts
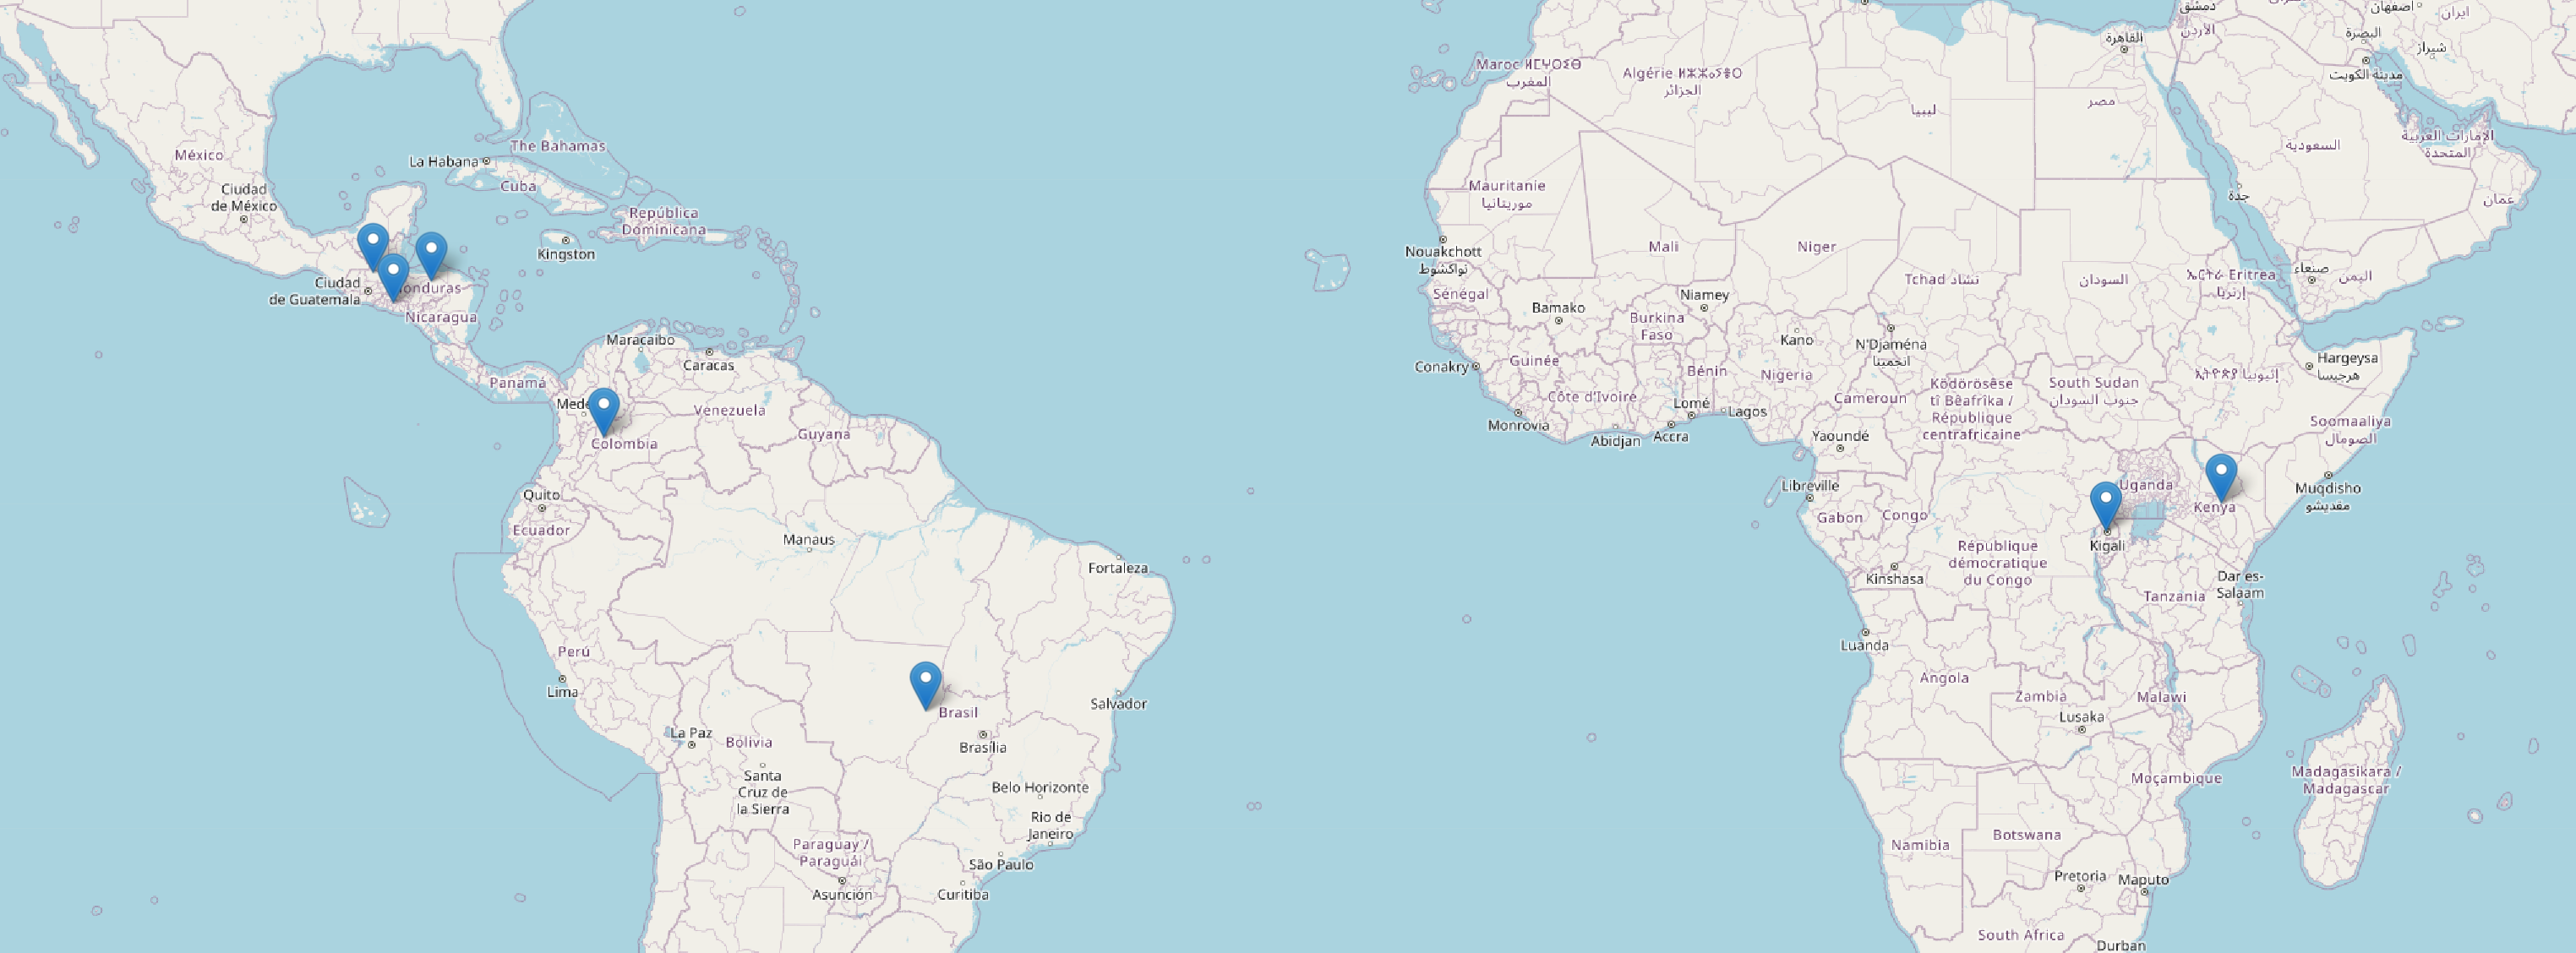
Coffee beans originated from: Brazil, Colombia, El Salvador, Guatemala, Honduras, Kenya and Rwanda
Brew methods used: Aeropress, Mokka Pot, with Turkish coffee brewed with an ibrik/cezve not tracked at this stage (I only recently went to turkey and purchased one) but may be included in future work along with espresso (I lack a machine capable of espresso currently).
I did not track cost as the coffees were purchased as part of a bundle so they did not have individual prices.
Rating process:
The rating process was blind as I did not know whether I was tasting a light or dark roast or which country the beans originated from.
I used a rating scale of 0-5 based on taste only, opting not to track aroma and aftertaste.
Statistical methods:
I used a one-sided Mann–Whitney U test because I had a directional expectation based on my prior belief that I dislike light roasts. This test compares two groups to see if the values in one group tend to be higher or lower than those in the other, without relying on averages.
In this context it helps answer the question:
"Are the ratings for light roasts generally lower compared to other roasts?"
Initially, I considered a one-sided t-test, which is a statistical method that compares the means (averages) of two groups to determine if they are significantly different. However, because the ratings were positively skewed (as shown in the histogram later), I opted to use the Mann–Whitney U test instead.
The Mann–Whitney U test:
Does not assume normality of the data (a bell curve).
Compares the ranks of values rather than their means.
Is ideal for small sample sizes and skewed data.
In contrast, the t-test assumes that the ratings in each group follow a bell-shaped (normal) distribution and compares their averages. When the ratings are unevenly spread (skewed) or contain extreme values, using the average can be misleading, which makes the t-test less reliable.
Results & Discussion
The histogram below shows how often each rating (from 0 to 5) occurred. We can see that most coffees received high scores, with fewer low ratings, indicating a positive skew in my taste preferences and a non normal distribution (no uniform bell shape).
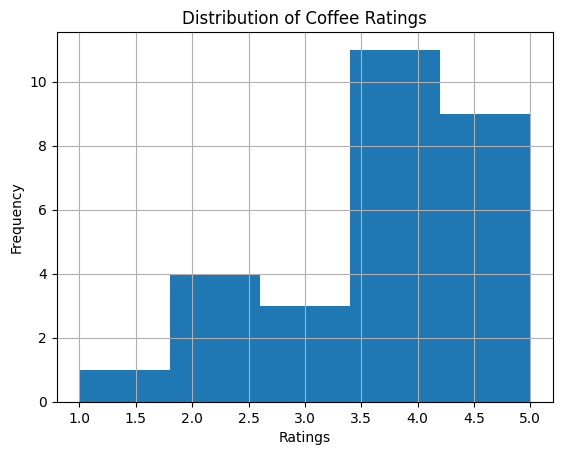
As a huge coffee fan, I enjoyed most of the samples, which likely explains the positive skew in the ratings. Additionally, all but one sample were specialty coffees, which tend to perform better than standard beans. So overall, the shape of the distribution isn’t too surprising, especially given my general enthusiasm for coffee.
Summary statistics:
Highlight uneven and small group sizes
Count of coffees per Origin: Brazil - 4, Colombia - 7, El Salvador - 4, Guatemala - 2, Honduras - 4, Kenya - 1, Rwanda - 4
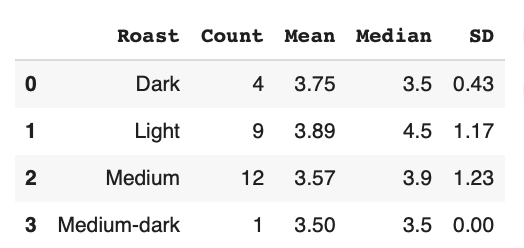
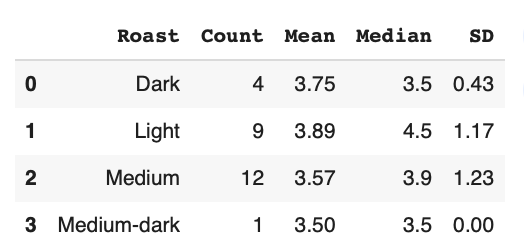
It turns out I actually enjoyed light roasts the most, with the highest median and mean ratings. This surprised me both during the tasting and in the final results, since I had never before found a light roast I liked, usually opting for dark or medium roasts when buying coffee.
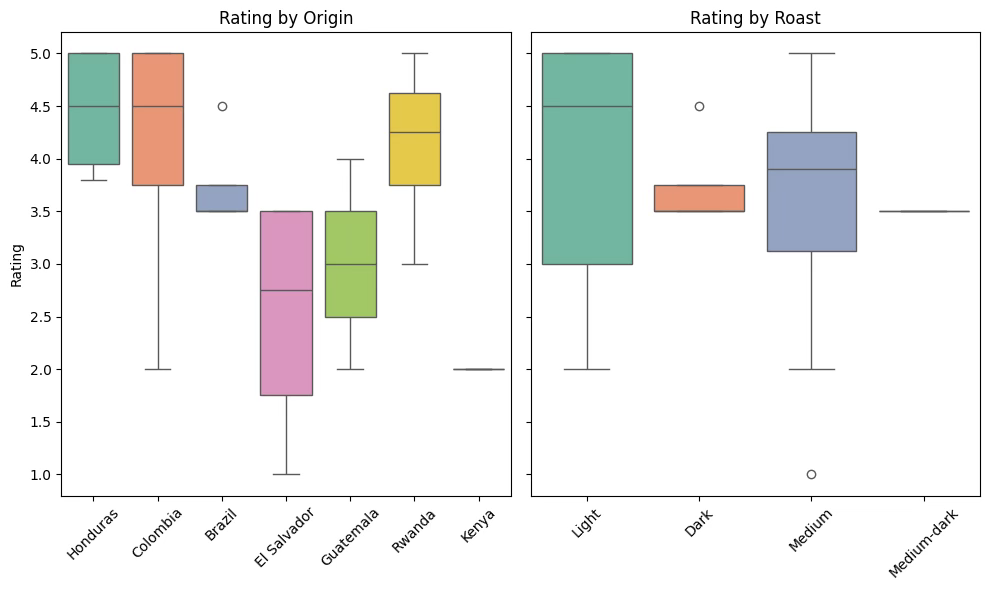
We can see from the box plot above that light roasts had the largest range (i.e., the most variability) and the highest median rating.
Count of coffees per Process: Anaerobic - 1, Honey - 2, Natural - 5, Washed - 8
Count of coffees per Acidity: Apple - 8, Creamy - 3, Lemon - 4, Lime - 4, Mild - 1, Orange - 4, Washed - 2
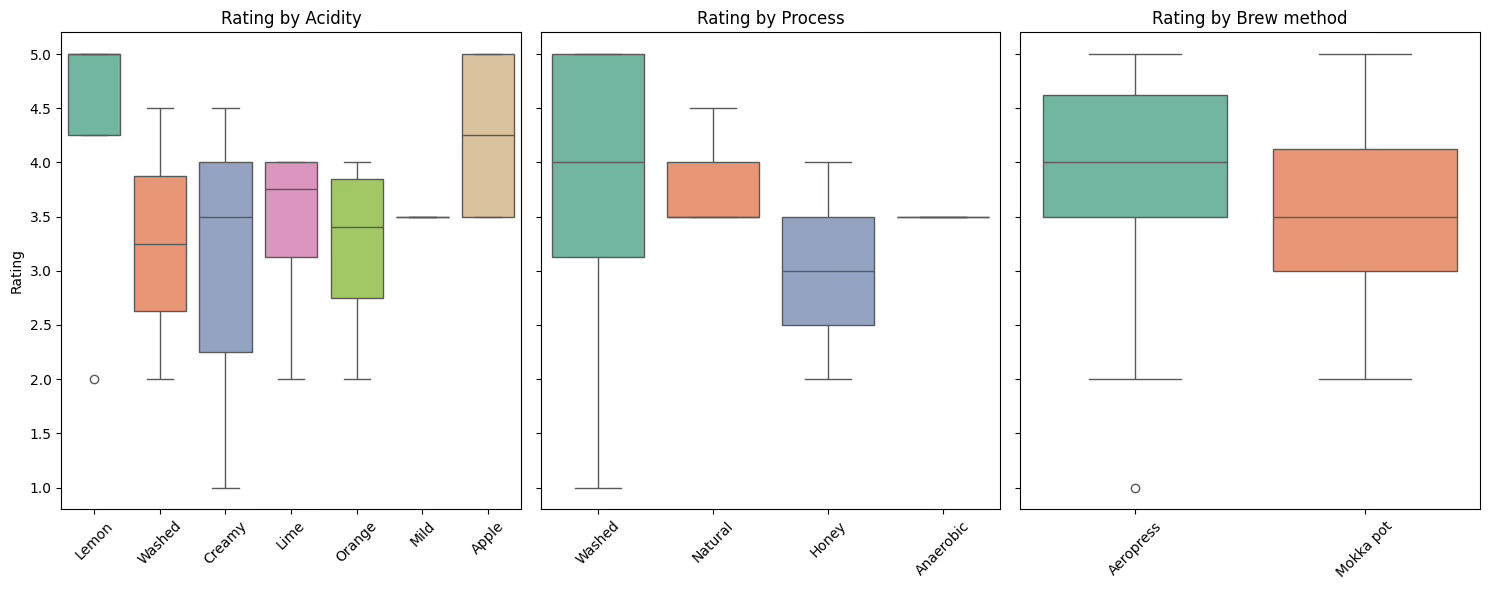
The difference in ratings across brewing methods was quite marginal with Aeropress performing slightly better (if you had asked me prior to crunching the numbers, I would have said that I preferred the mokka pot brewing process), we cannot draw meaningful conclusions from the remaining categories due to the small sample sizes.
One sided Mann–Whitney U test results ():
Despite a small sample and my prior belief that I dislike light roasts, the Mann–Whitney U test (U = 92.0, p = 0.81) did not yield statistically significant evidence that I rate light roasts lower than medium, dark, or medium-dark roasts.
In fact, the light roasts in this sample had a slightly higher average rating. This suggests that while I may dislike certain light roasts, I don't consistently rate them lower as a group and my dislike may not be based on actual taste performance but possibly on expectations or a few specific bad experiences. Light roasts may simply be more variable in taste, making them more "hit or miss" rather than consistently worse.
Limitations and Challenges
The sample size was quite small at only 26.
Rating food or drinks tends to be quite subjective and my preferences could have changed as I conducted this experiment.
Brewing temperature was not strictly controlled for (Aeropress is also brewed at a lower temp than a Mokka pot).
Since most tastings were done in the mornings, often when I was tired, some data points were missed. I always use decaf regardless, but missing entries do limit the analysis.
I couldn’t retest some coffees due to limited quantities, each sachet was a single-use portion and were tasted on different days rather than the same day.
Conclusion
There wasn’t enough evidence to support my belief that I dislike light roasts. In fact, they slightly outperformed the others, much to my surprise.
Small sample size limited conclusions.
Personal Takeaway
This project nudged me to expand my coffee preferences, light roasts are now firmly on my radar.
I’ve become more open-minded and curious when tasting new coffee.
It’s a reminder that personal taste isn’t always as fixed as we think.
Future work
As I collect more data, I’d like to model individual factors more, such as acidity, processing method, or origin, to see what influences my ratings the most.
Drink more coffee! ☕️